

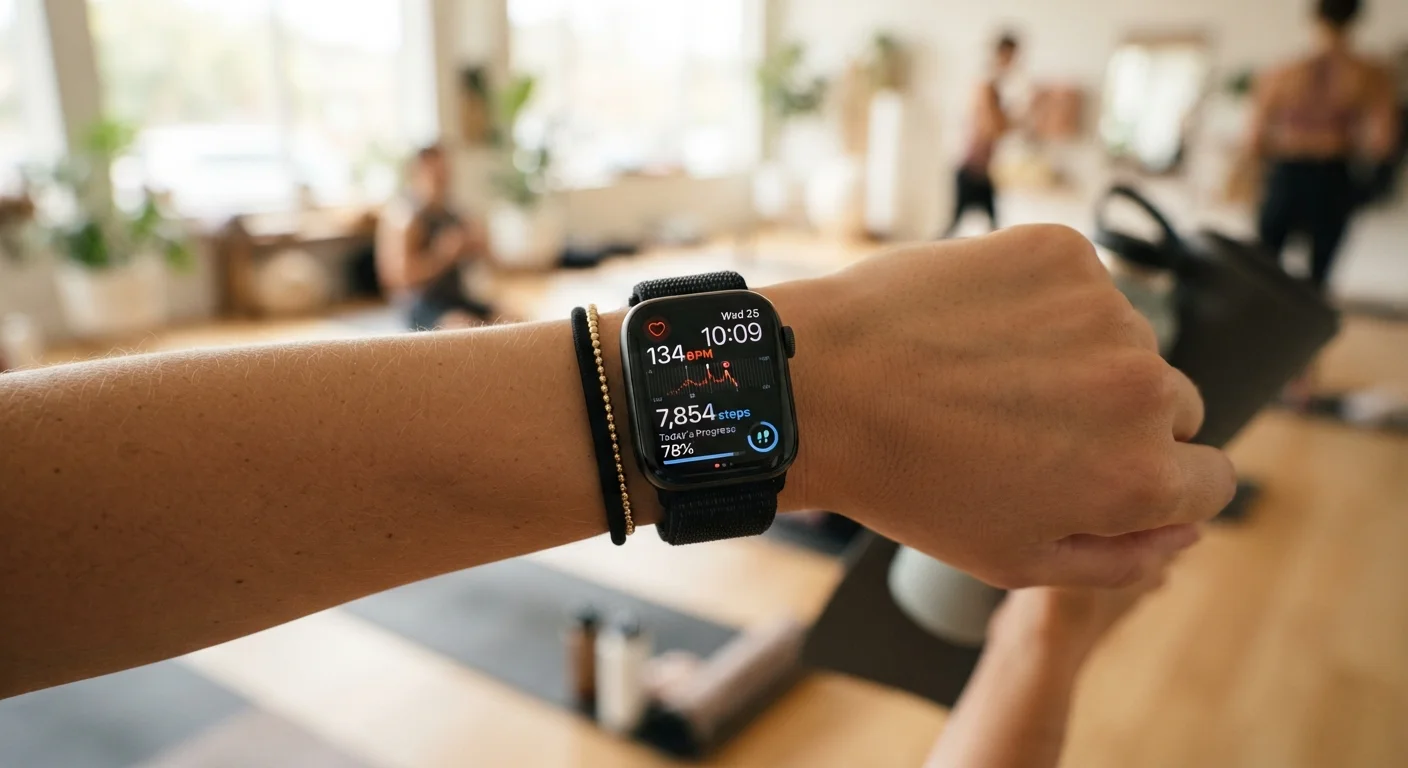
Why Fitness Metrics Can Feel Confusing
Fitness trackers and smartwatches now collect more data than most people know what to do with. Steps, calories, heart rate zones, VO2 max, HRV - the list grows every product cycle. Without context, raw numbers can feel more like noise than guidance.
This reference guide breaks down the most common fitness metrics in plain language: what each one measures, how it's typically calculated, and what it can - and can't - tell you about your health. It is general information, not a substitute for individualized medical advice. If you have specific health concerns, consult a qualified healthcare professional.
| Common step goal | 7,000-10,000 steps/day (JAMA Internal Medicine, 2021) |
| Typical adult RHR range | 60-100 bpm (American Heart Association) |
| VO2 max unit of measure | mL/kg/min |
| Wearable calorie error margin | Up to ~40% (Stanford University study, 2017) |
| Recommended sleep duration (adults) | 7-9 hours (American Academy of Sleep Medicine) |
Steps, Distance, and NEAT
Step count is arguably the most familiar metric. Accelerometers inside wearables detect wrist or hip movement patterns and translate them into steps. It is a proxy for overall daily movement rather than a precise measurement - accuracy varies by device and how you carry it.
The widely cited target of 10,000 steps per day originated as a marketing concept, not a clinical standard. Research published in journals such as JAMA Internal Medicine suggests meaningful cardiovascular and mortality benefits begin accumulating well below that threshold, with gains tapering off at higher counts. More movement is generally better, but any increase from your baseline is a positive step.
Step count closely relates to NEAT - non-exercise activity thermogenesis, the energy your body uses for all movement outside structured exercise. Learn more about how NEAT contributes to daily calorie use and why it adds up more than many people expect.
Heart Rate and Heart Rate Zones
Resting heart rate (RHR) is the number of times your heart beats per minute while you are at rest. For most adults, a typical range is roughly 60-100 bpm, though well-trained individuals often register lower. A sustained downward trend in RHR over weeks can signal improved cardiovascular fitness; a sudden spike may indicate stress, illness, or poor sleep.
Heart rate zones are percentage bands of your estimated maximum heart rate (commonly calculated as 220 minus your age, though this formula has meaningful individual variation). Exercising in different zones emphasizes different energy systems - lower zones support fat oxidation and aerobic base building, while higher zones train anaerobic capacity and speed. Zone-based training is one reason activity type matters. Running and walking place different demands on the cardiovascular system, even at comparable effort levels.
Heart rate variability (HRV) measures the millisecond-level fluctuations between heartbeats. Higher HRV generally reflects a more resilient autonomic nervous system and is associated with better recovery. Trackers display HRV trends rather than single readings; day-to-day values are less meaningful than your personal baseline.
Resting Heart Rate (RHR)
The number of heartbeats per minute while the body is fully at rest. A lower RHR often - though not always - correlates with better cardiovascular fitness.
Heart Rate Variability (HRV)
The variation in time between successive heartbeats, measured in milliseconds. It reflects autonomic nervous system balance and is commonly used as a recovery and readiness indicator.
VO2 Max
The maximum volume of oxygen the body can use during peak exercise, expressed in mL/kg/min. It is widely regarded as a key marker of aerobic fitness and cardiovascular health.
NEAT
Non-exercise activity thermogenesis - the energy expended through all movement that is not structured exercise, including walking, fidgeting, and daily tasks.
Heart Rate Zone
A percentage band of an individual's estimated maximum heart rate. Different zones target different physiological systems, from fat oxidation at lower intensities to anaerobic capacity at higher ones.
SpO2 (Blood Oxygen Saturation)
An estimate of the percentage of hemoglobin in the blood carrying oxygen. Wearable SpO2 readings use optical sensors and are not equivalent to clinical pulse oximetry.
VO2 Max and Aerobic Capacity
VO2 max is the maximum rate at which your body can consume oxygen during intense exercise. It is expressed in milliliters of oxygen per kilogram of body weight per minute (mL/kg/min) and is considered one of the strongest predictors of long-term cardiovascular health and all-cause mortality in published research.
Consumer devices estimate VO2 max using algorithms that combine heart rate data with activity speed or pace - they do not measure it directly. Lab-based measurement requires a maximal exercise test with gas analysis equipment. Wearable estimates can be directionally useful for tracking trends, but treat the absolute number with appropriate skepticism.
VO2 max responds to consistent aerobic training. Activities that elevate heart rate for sustained periods - running, cycling, swimming, brisk walking - contribute to improvements over months of regular effort. It also declines with age and inactivity, which makes it a useful long-range metric to watch even for people who are not athletes.
~40%
Potential error in wearable calorie estimates
A Stanford University study found consumer fitness trackers can misestimate energy expenditure by up to 40% depending on device and activity type.
7,000+
Daily steps linked to lower mortality risk
Research in JAMA Internal Medicine found meaningful mortality benefits associated with reaching approximately 7,000 steps per day in older adults.
60-100 bpm
Normal resting heart rate range for adults
The American Heart Association identifies this as the typical range, noting that trained athletes may register considerably lower.
Calorie Estimates, Sleep Scores, and Other Metrics
Active calories vs. total calories: Trackers typically distinguish between resting energy expenditure (calories burned existing) and active calories burned during movement. Both figures are estimates derived from formulas using age, weight, height, and heart rate. They carry meaningful error margins - studies suggest wearable calorie estimates can vary from actual expenditure by 20-40% depending on the device and activity type. Use them as rough reference points, not precise accounting.
Sleep tracking uses movement and heart rate data to infer sleep stages (light, deep, REM). Consumer-grade sleep staging is less accurate than clinical polysomnography, but trends in sleep duration and consistency are still informative. Prioritizing 7-9 hours of sleep for most adults is well-supported by research - the precise stage breakdown is a helpful but imperfect window into sleep quality.
Blood oxygen (SpO2) sensors on wearables use optical pulse oximetry to estimate oxygen saturation. These readings are not medical-grade and should not be used to diagnose or monitor health conditions. If you have concerns about your oxygen levels, consult a healthcare professional who can use validated clinical tools.
Fitness data works best when you track trends over time rather than reacting to single readings. Pair what your device shows you with how you actually feel - energy levels, performance, and recovery are context that no sensor fully captures.